figure(1);nyquist(G);axis([-2 0 -0.5 0.5])
t=0:0.01:15;c01=[-2 0 0]';[t,c1]=ode23('sys826',t,c01);
figure(2);plot(c1(:,1),c1(:,2));grid
figure(3);plot(t,c1(:,1));grid
调用函数:
function dc=sys826(t,c)
K=2;M=3;
dc1=c(2);
dc2=c(3);
if (c(1)<-1)
        dc3=-11*c(3)-10*c(2)+10*M*K;
elseif (abs(c(1))<1)
        dc3=-11*c(3)-10*c(2);
else dc3=-11*c(3)-10*c(2)-10*M*K;
end
dc=[dc1 dc2 dc3]';
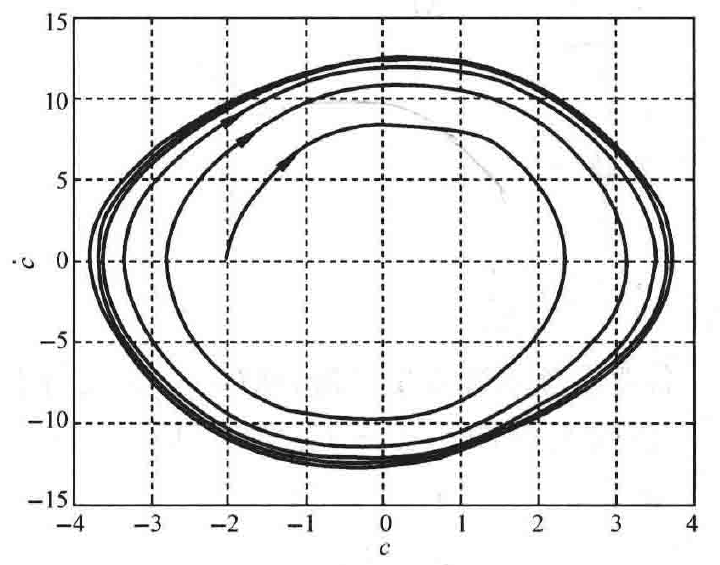
图 8-73 系统自激振荡时的 \(\dot{c}\)-\(c\) 相轨迹
(MATLAB)
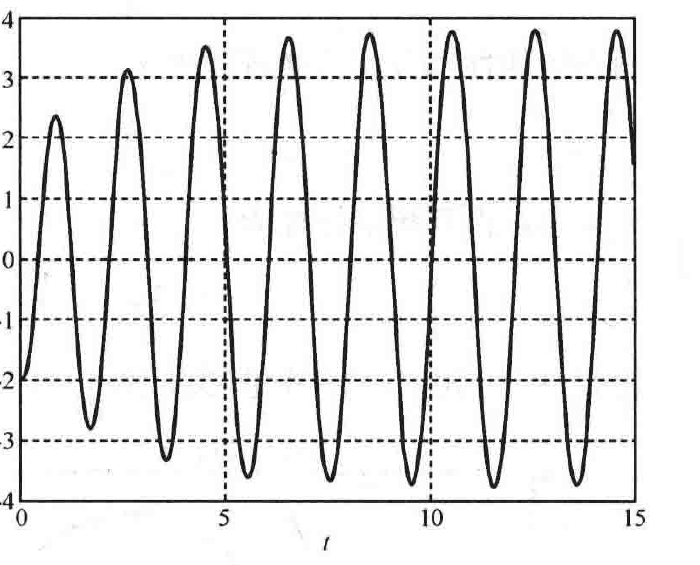
图 8-74 系统自激振荡时的输出曲线
(MATLAB)
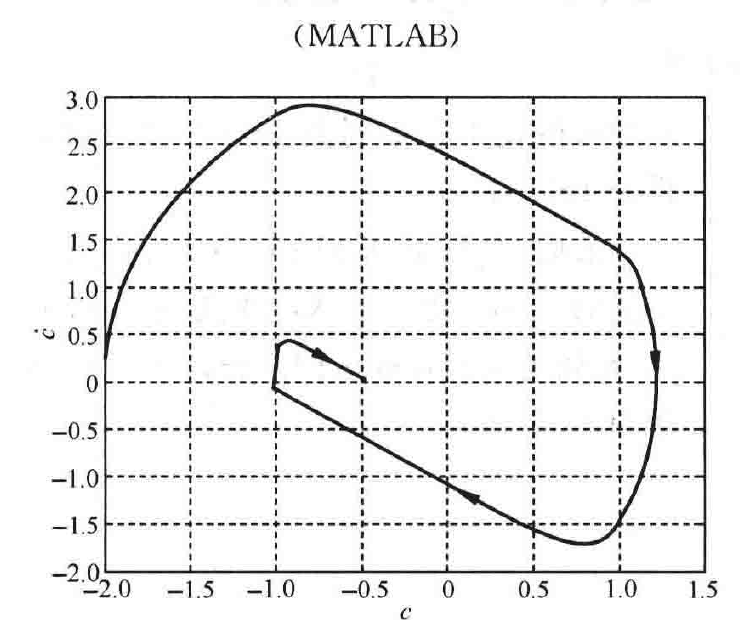
图 8-75 系统无自激振荡时的 \(\dot{c}\)-\(c\) 相轨迹
(\(K=2\),MATLAB)
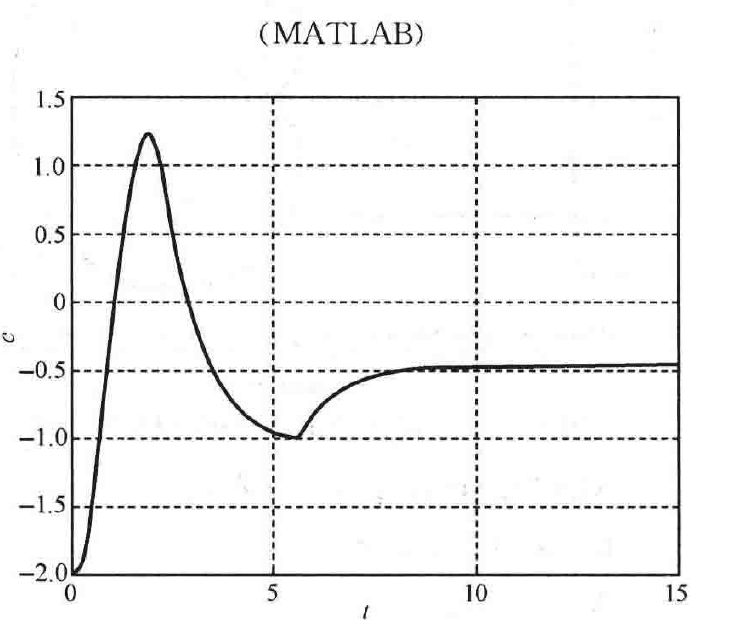
图 8-76 系统无自激振荡时的输出响应曲线
(\(K=2\),MATLAB)
· 459 ·